A Short History of Inflation in the US; 1914 to 2022
By Dan Nastou, CFA
I’m sure it comes as no surprise that inflation has been running hot over the past two years. In fact, annual inflation for 2021 and 2022 reached levels not seen since the early 1980s. And while there have been some promising signs lately that it may finally be slowing, inflation still remains a major concern for consumers and policy makers like the Federal Reserve.
So we thought it would be helpful to take a deeper dive and see how our current bout of high inflation fits into the broader history of inflation in the US and what it means for our money.
Let’s get to it!
But first, what is inflation? And why do we have it?
Simply put, inflation represents the general increase in prices of goods and services over time.
I’m not going to get into all the nitty-gritty details here, but basically, when the supply of money in the economy grows faster than the amount of real stuff out there to buy, prices tend to rise.
Now obviously this isn’t ideal for consumers and savers like you and me – no one likes their money to lose its value. But the government actually aims to have a small amount of inflation every year. “What? That sounds like a terrible idea!” I hear you thinking.
Well, as it turns out, there are actually a few reasons why it makes sense. The main one being that when people expect prices to rise slightly from one year to the next, they’re more likely to spend money now rather than wait for prices to fall later. And this helps the economy chug along.
Alternatively, if the money supply doesn’t grow fast enough, we can get hit with falling prices or deflation. This might sound like a good thing – cheaper stuff! – but when prices steadily fall, consumers tend to wait to make purchases, which can slow the economy to a grinding halt and potentially lead to an economic depression. Generally speaking, depressions are something we want to avoid, both personally and economically.
So governments usually try to err on the side of having a little bit of inflation, thinking it the lesser of two evils. The key is making sure a little bit of inflation doesn’t turn into a lot.
WES Note: We do a deeper dive on inflation and a range of other personal finance topics in our Core Content. Learn more about getting started!
Tracking inflation with the CPI
So how do we actually track inflation? Well, that’s where the CPI, or Consumer Price Index, comes in. It’s an index, or mathematically constructed measurement, that tracks the prices of commonly consumed goods and services over time.
Of course, we all spend our money on slightly different things, so the CPI can’t track everyone’s cost of living perfectly. But the idea is to track average costs in the US. And technically speaking, what we usually follow is something called the CPI-U which specifically tracks average costs for urban Americans.
The CPI is managed by the Bureau of Labor Statistics and every month the BLS releases an update showing how much the CPI has changed over the past month and over the past year. The report includes a breakdown by various categories, including energy, food, and apparel to name a few. You can check out the latest report here.
Looking at the past 100 years of CPI
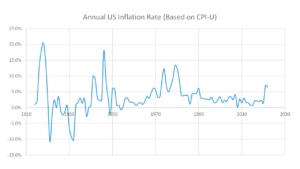
As we mentioned, inflation has been running the hottest it’s been in forty years. But what about before that? Well, let’s check it out! Here’s a chart showing the annual increases in CPI-U going all the way back to 1914. In other words, annual inflation.

Source: Bureau of Labor Statistics data sets
A few things to point out;
1) Over the years, the inflation rate has fluctuated, a lot. Since 1914, annual inflation has hit a maximum of 20.4% in 1918 and a minimum of -10.8% in 1921 (negative inflation meaning deflation, or falling prices). We’ve seen several periods of inflation greater than 10% as well as multiple deflationary periods.
2) Since the early eighties, we have mostly enjoyed fairly low and stable inflation, typically running around 2-4% per year. Clearly 2021 and 2022 were exceptions to this.
3) Prior to 2021, the most recent bout of “bad” inflation in the US was during the 1970s/early 1980s. This is particularly important because some people in the financial world (including the Federal Reserve) fear that we could potentially see a repeat of this period, to some extent, if we aren’t careful. So it’s worth checking out this decade a little more closely.
Inflation in the 1970s and early 1980s
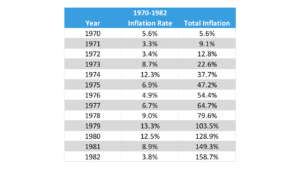
Here’s a year by year breakdown of inflation for this period. We’ve included the annual rates as well as the cumulative total in the column on the right.

Source: Bureau of Labor Statistics data sets
As you can see, it was a rough stretch. Annual inflation exceeded 10% in several years. And total cumulative inflation was more than 150% from 1970 to 1982. This means that on average, stuff cost more than two and a half times as much in 1982 as it did in 1970. Or in other words, a dollar lost more than 60% of its value in just over a decade! For comparison, when inflation is running at 2% a year, it takes roughly 35 years for a dollar to lose half its value. Scary stuff.
There was even a fake out period in the mid 70s when inflation started to decline, only to rise again to a new high by the end of the decade. To ultimately stabilize prices, the Federal Reserve had to raise short-term interest rates to nearly 20% in the early eighties. For context, so far this time around the Fed has only raised rates to just over 4%.
Long story short, this was an ugly time for the economy – economists often use the word “stagflation” to describe the period, referring to the rampant inflation and stagnant economy that accompanied it – and it’s definitely something we want to avoid repeating.
This is why the Federal Reserve has been aggressively raising interest rates over the past year, trying to stop inflation before it becomes entrenched in the economy. We have a more in-depth explanation of the link between the Federal Reserve, inflation, and the stock market here.
So what should we learn from all of this?
History never exactly repeats, but it can provide helpful context for what’s happening today. And while there are a number of points we could take away, I want to highlight two.
1) We aren’t out of the woods yet with the current bout of inflation. On the plus side, the most recent CPI reports have shown some promising indications that inflation may finally slowing, but it’s still too early to claim victory. The Fed remains focused on slowing inflation to its target of 2% and has steadily hiked interest rates over the past year to do so. There very well could be more bumps in store for the economy and financial markets before it’s over.
2) Inflation is always something we need to pay attention to. The past two years of high inflation have certainly brought more attention to it, but the reality is, inflation is always there. And it’s always something we should incorporate into our financial plans. Even when inflation is 2-3% a year, it will still have a big impact on our finances, especially over the longer term. So we need to adjust for inflation any time we plan out future money needs. And for most of us, it will mean keeping at least some of our wealth in investments that tend to keep up with or outpace inflation, like stocks, real estate, and bonds to some extent.
At the end of the day, the current bout of high inflation doesn’t mean we’re in the midst of a financial catastrophe. Tomorrow will come. And inflation will cool, eventually. But it is something we all need to be aware of and prepared to navigate.
As always, this is education, not financial advice. Talk to your financial professional if you need help or are thinking about making changes to your investments.
Looking for more?
Learn more about what we offer
Check out our investing cheat sheet
How to save more money with automation
How to refinance your student loans


